
Analyzing Performance
Optimize ad campaign potential by knowing how your campaign and creatives are performing.
Creatives are assigned a respective Creative ID# and campaigns a Campaign ID#.
Advertiser Statistics
A broken down view of the most important statistics on your campaign(s).
Report Builder
The Report Builder provides you a customizable view of your campaign’s statistics.
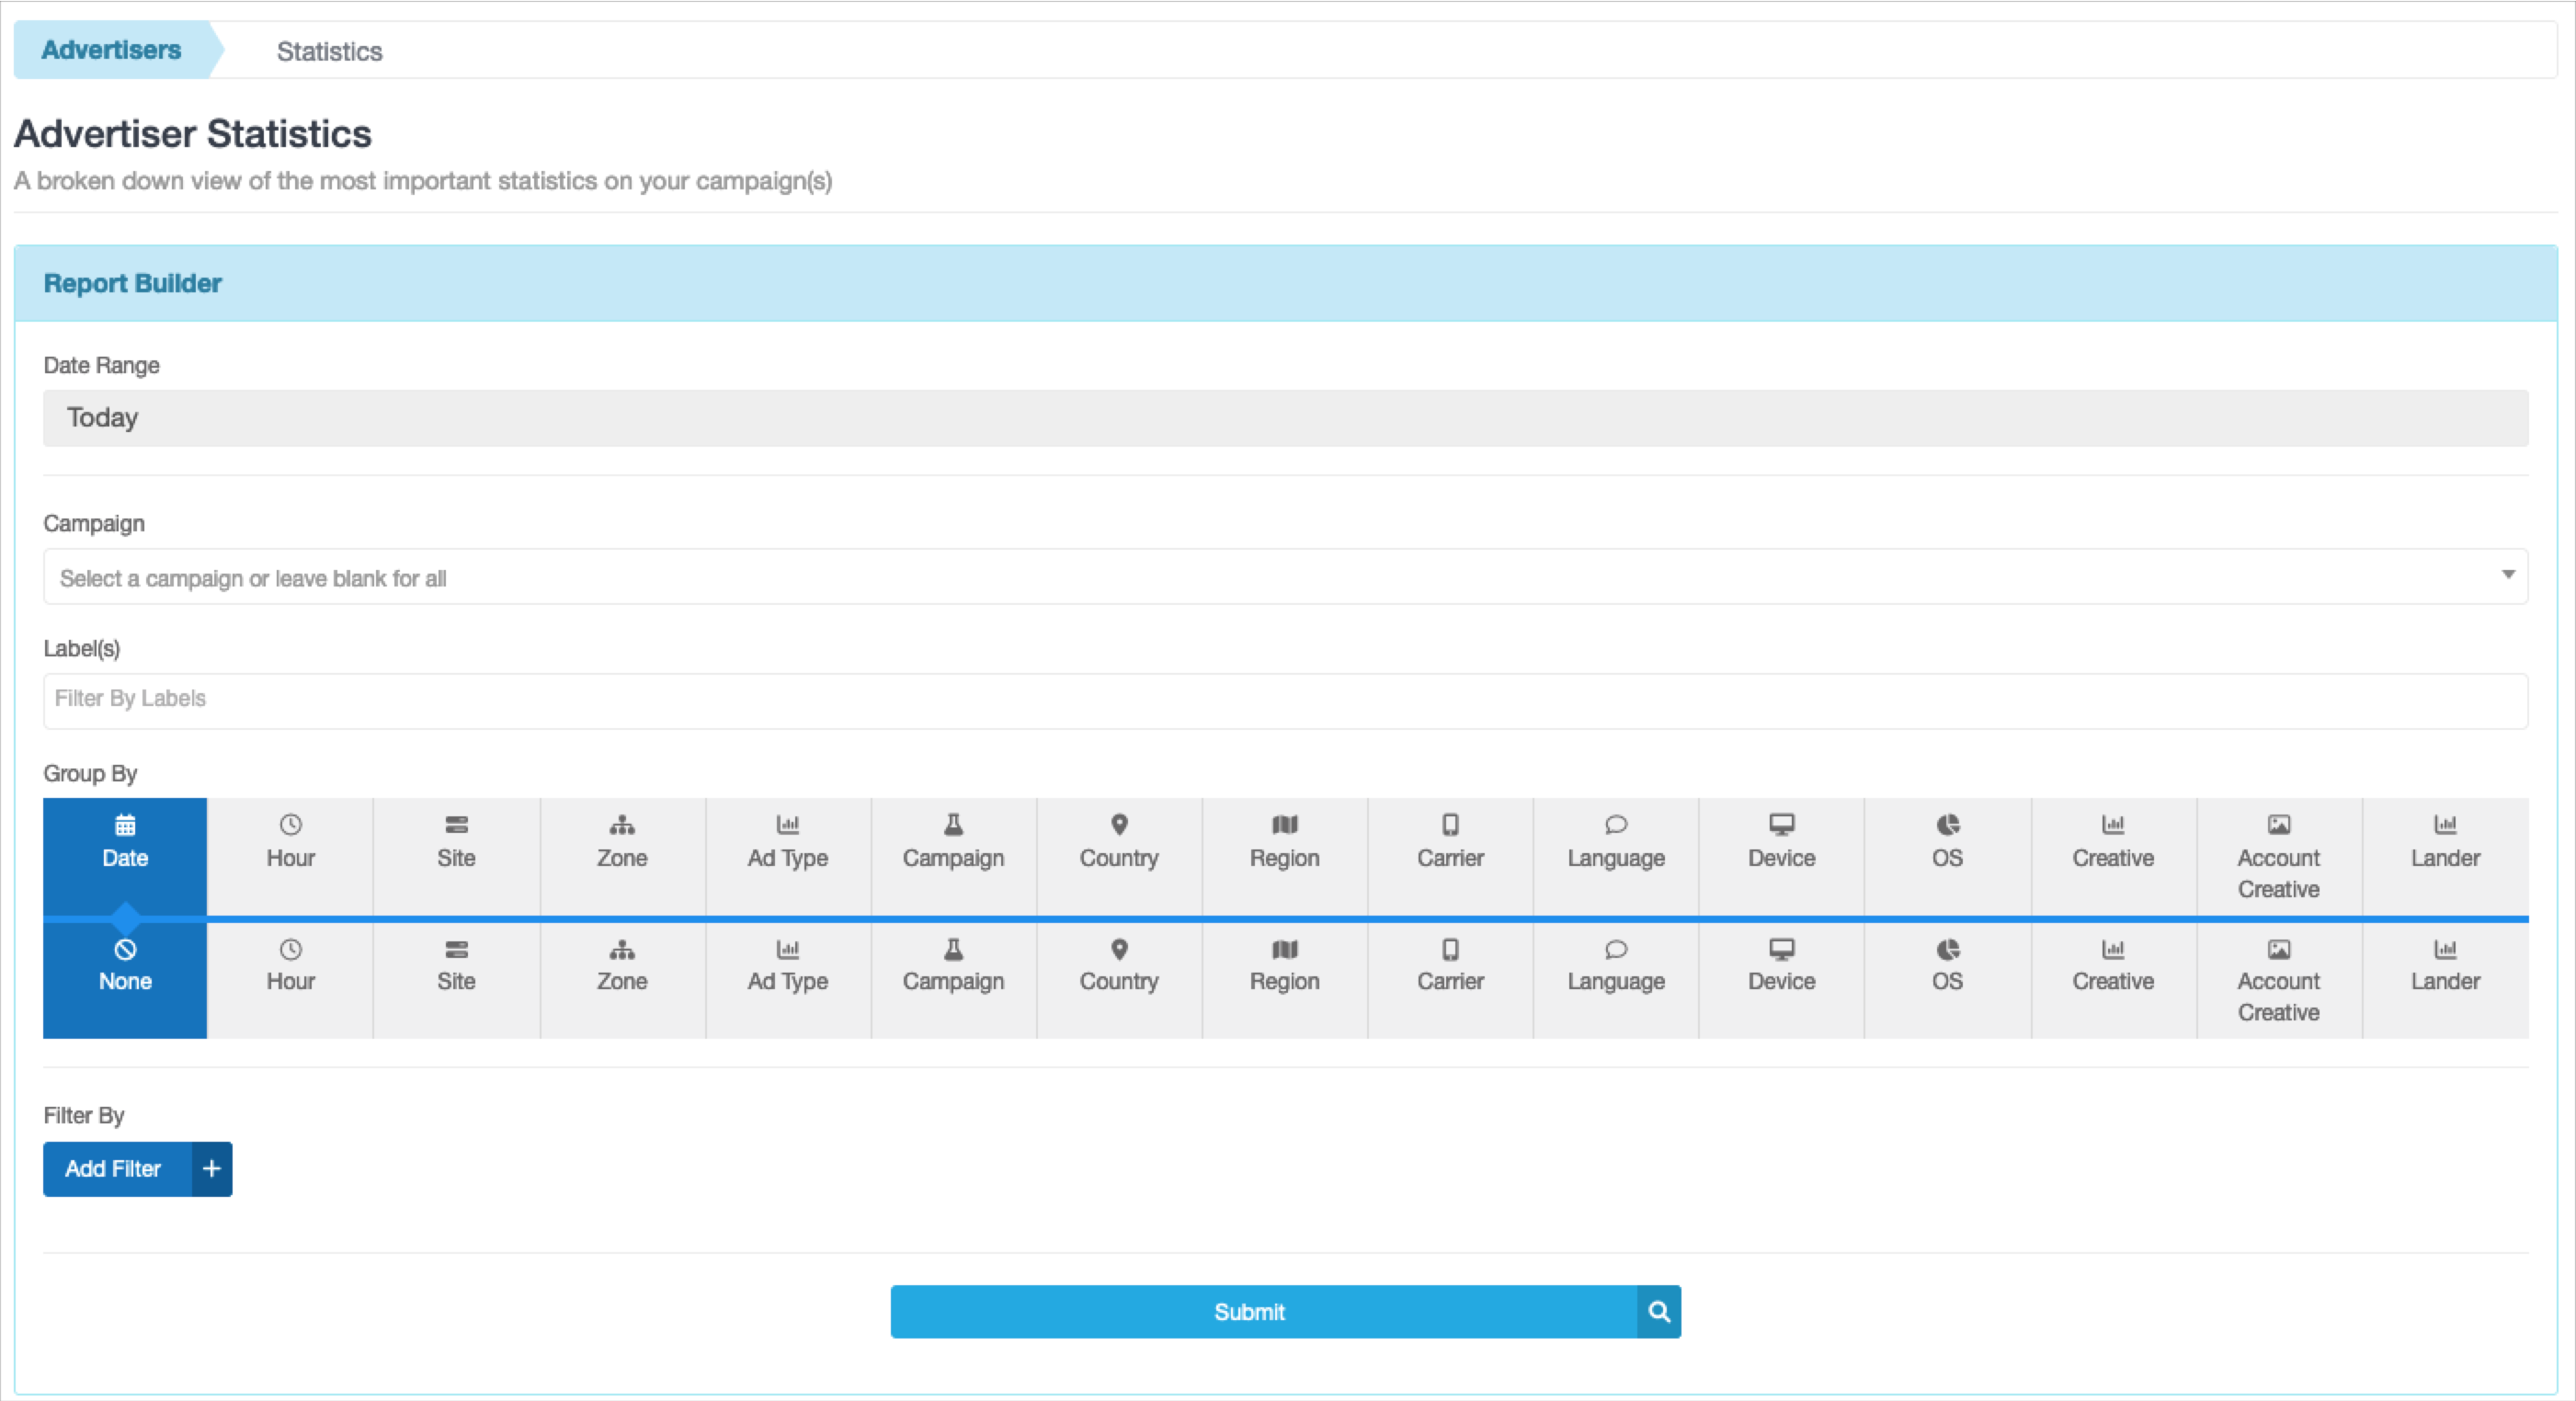
From the main menu, navigate to “Advertisers” and select the “Statistics” drop down option.
Alternatively, from your dashboard, select the blue “Advanced Statistics” box above the overview graph.
Building the Report
In the Report Builder select the:
• Date Range* for which you wish to view statistics for
• Campaign of which you wish to view statistics for - search name or ID
• Label(s) you wish to filter the results for
• Group By* section(s) - first row is required and influences what information is displayed in the graph and determines the grouping for the data in the chart below
• Add Filter option to further filter the data by IS or is NOT
• blue “Submit”* box to build the report
* indicates a required field
Date Range: Last 7 Days
Group by: Creative and Date to see what date(s) a creative performed best on
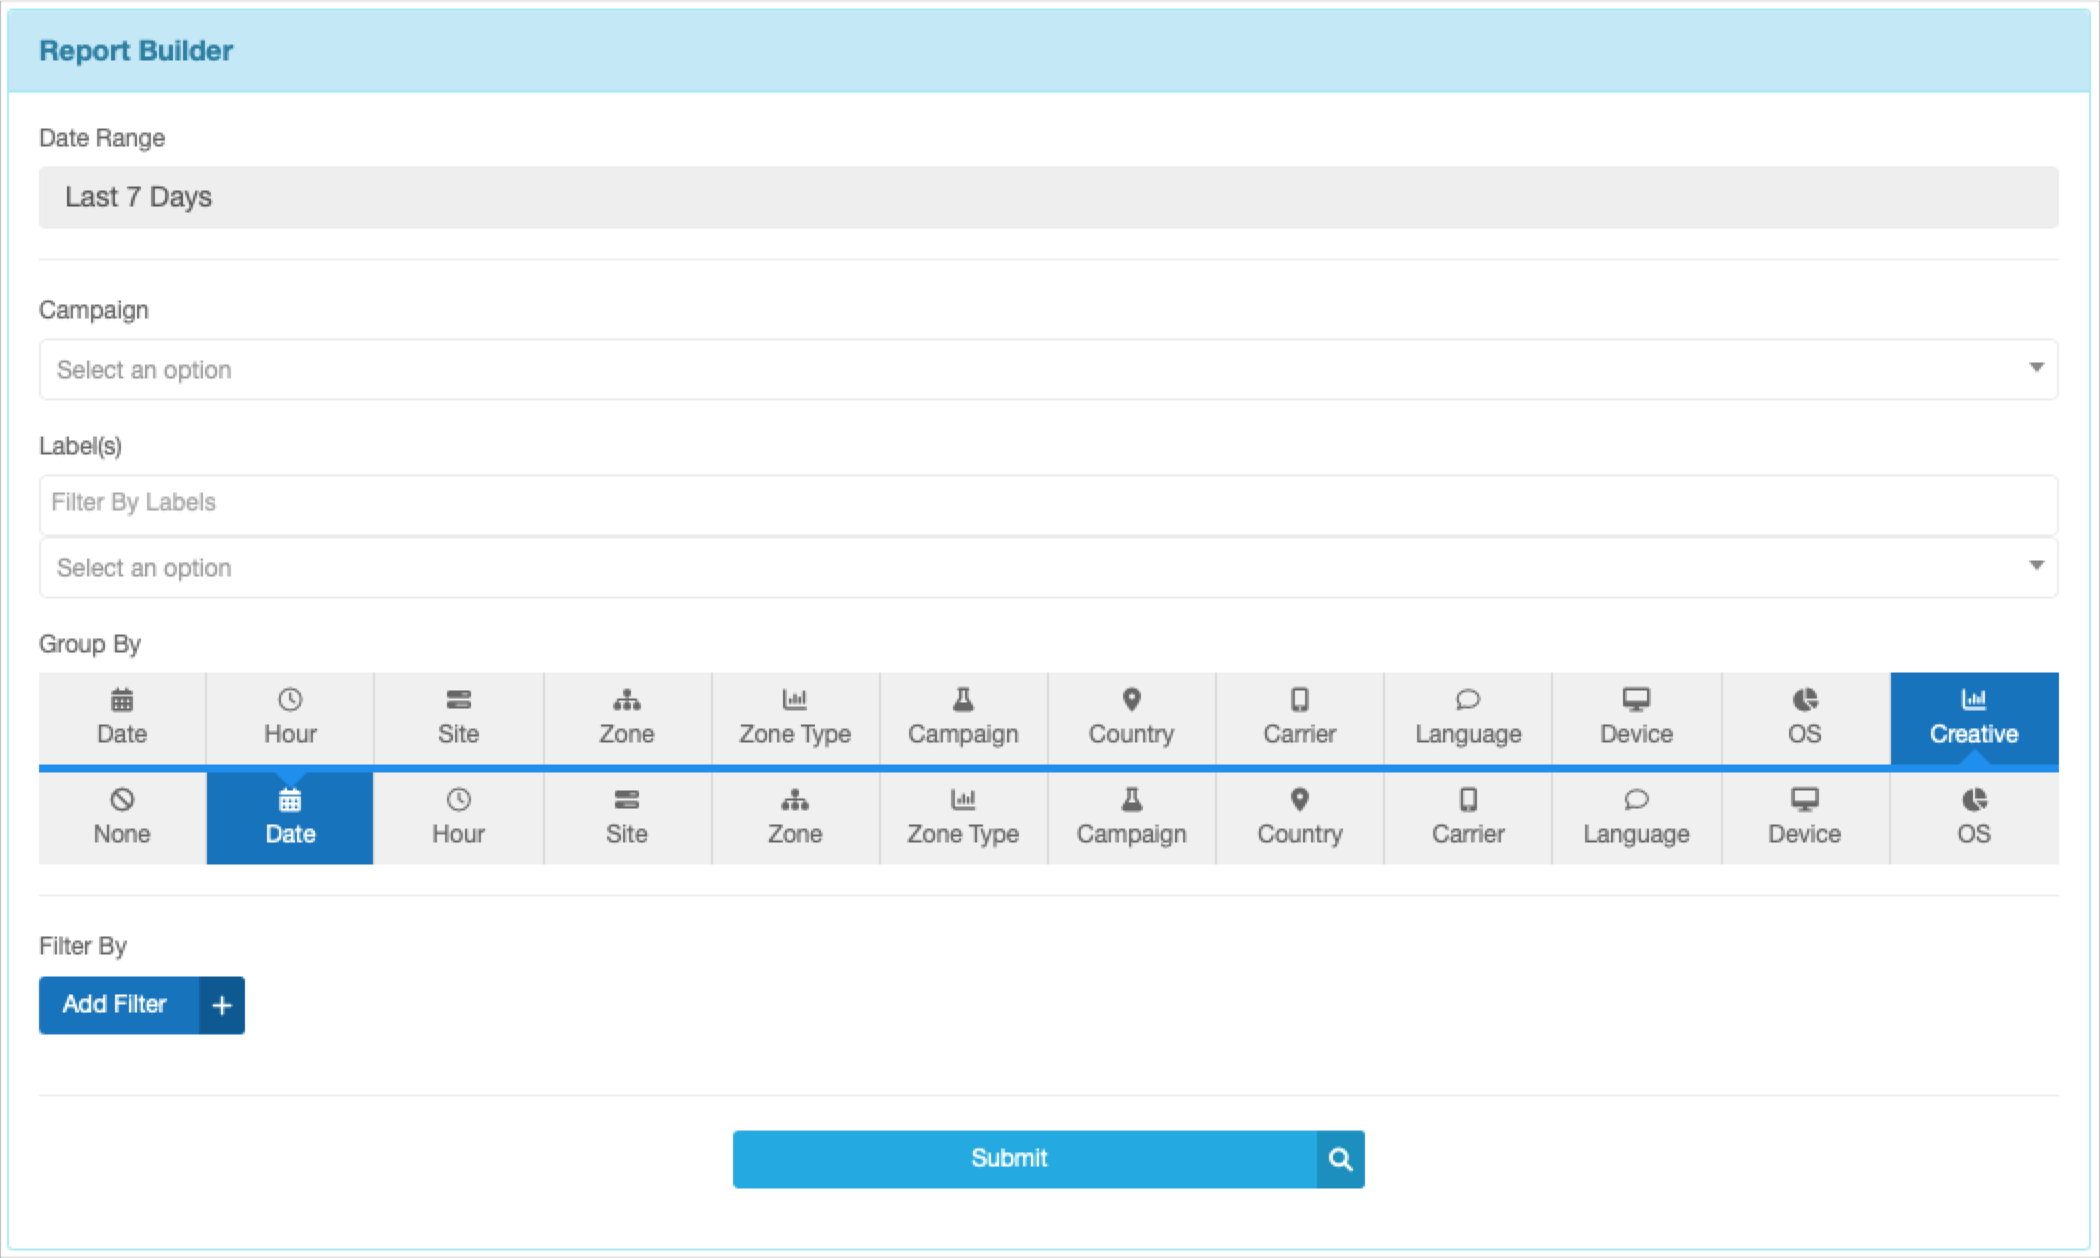
The graph displays the impressions per each creative within the date range (last 7 days).
The chart below it is organized by Creative per each Date within the date range. Each row displays a creative’s ID for that date (per our “Group By” selection criteria).
A creative appears in several rows of the chart because there is data from several dates.
Editing the Graph
Here, you can adjust the Y and X axis of the graph, respectively.
• Underneath the Report Builder and above the graph is “Displaying” options.
• Select the drop down menu option of either box, select a new variable, and the graph will automatically reflect this.
EXAMPLE If “Spend” and “Date” are selected with our previous Report Builder settings, then we would see the progression of how much was spent each day on the ad campaign.
Campaign Statistics
This page provides a broken down view of the most important statistics on your campaign(s).
Report Builder
The Campaigns Statistics Report Builder is campaign specific.
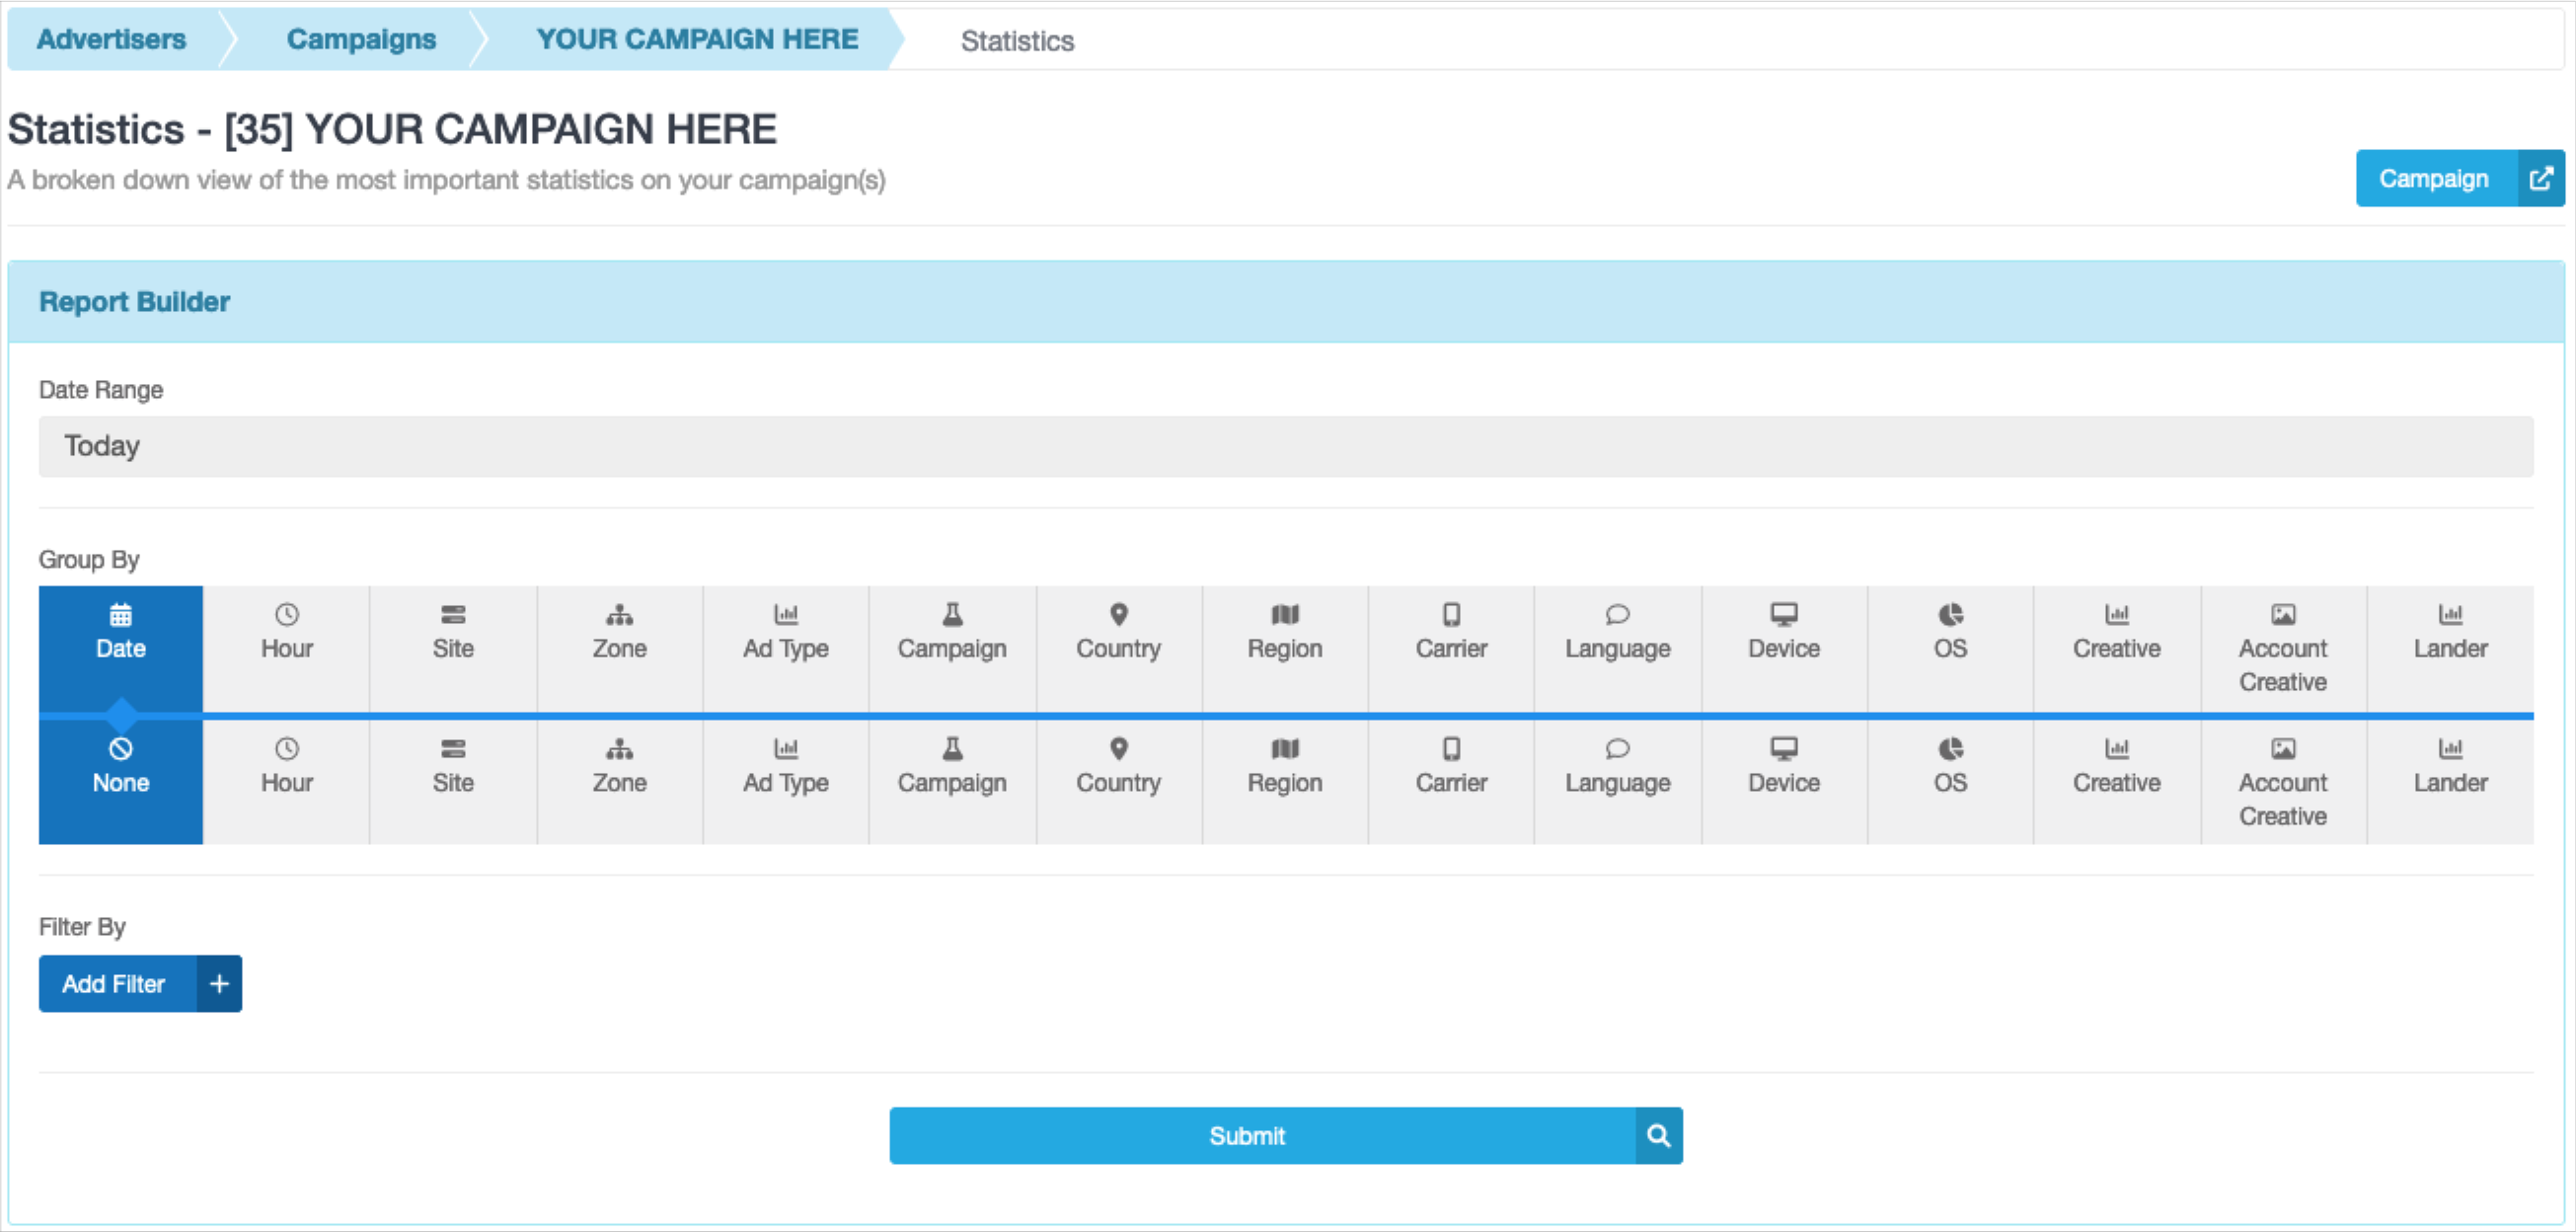
The Report Builder for Campaign Statistics is similar to the Advertisers Statistics' but has fewer customizable options.
If you group by “Creative” only, you can Pause creatives by unselecting their checkboxes.
From the main menu, navigate to “Advertisers” and select the “Campaigns” drop down option.
View an ad campaign’s statistics by selecting the statistics icon next to it’s name or by accessing the drop down menu in Actions, “✱”, and selecting “View Stats”.
Alternatively, you can also select the Name of the campaign from the campaigns page which bring you to the Campaign Overview. From there, you can select “Statistics” from the left side menu or the blue “More stats” box above the weekly overview.
The displayed Report Builder is specific to the selected ad campaign, as indicated by the title: “Statistics - [ID#] YOUR CAMPAIGN HERE”.
Another alternative to view the statistics of a specific ad campaign is through accessing the Advertiser Statistics Report Builder and then selecting a specific campaign from the Campaign filter.
Building the Report
In the Report Builder select the:
• Date Range* you wish to view statistics for
• Group By* section(s) - first row is required and influences what information is displayed in the graph and determines the grouping for the data in the chart below
• Add Filter option to further filter the data by IS or is NOT
• blue “Submit”* box to build the report
* indicates a required field
EXAMPLE If “Today” for Date Range and “Hour” for Group By are selected for an active campaign (“None” for the second row), then it would display how many impressions the ad campaign received each hour it was active today.
Editing the Graph
Here, you can adjust the Y and X axis of the graph, respectively.
• Underneath the Report Builder and above the graph is “Displaying” options.
• Select the drop down menu option of either box, select a new variable, and the graph will automatically reflect this.
Creative Statistics
View performance of all creatives, creatives in a select campaign(s), and/or a select creative.
From the Creatives Library
Access to all creatives that have been uploaded to the Creatives Library.
• From the main menu, navigate to “Advertisers” and select the “Creatives” drop down option.
• In the Creatives Library, double click a creative to view its Creative ID#, Ad Type, and Status along with its current Impressions, Clicks, and CTR.
By Building a Report
Alternatively, by accessing either the Advertiser Stats or Campaign Stats Report Builder you can build a report displaying performance of all creatives, creatives in a select campaign(s), or a select creative.
EXAMPLE 1 If “Yesterday” for Date Range and “Creative” for Group By are selected in the Advertisers Stats Report Builder (“None” for the second row), then how many impressions each creative received yesterday would be displayed - regardless of campaign.
EXAMPLE 2 If “Today” for Date Range, “Creative” for Group By, and “Campaign Is” for Add Filter with “YourCampaign”, then today’s impressions per creative for that specific ad campaign would be displayed.
Spend Overview
The graph on your Dashboard displays a breakdown of daily spend for the last 14 days.
• From the main menu, navigate to “Advertisers” and select the “Dashboard” drop down option.
• You can navigate to Advertiser Statistics by selecting the blue “Advanced Statistics” box above the graph.
Hover your cursor over a bar in the graph to concisely display that date’s information.